GIS
I'm writing this posting for two reasons. Firstly my company is currently engaged in a project with a client about getting more of their data onto their intranet based mapping tool, so I've spent the last 3 days researching and getting back up to speed on the industry.
Secondly my brother has just got a new job working as sales manager for a company providing GIS data, so I thought an introduction and overview of the subject might be of use to him. Apologises if I get too technical Mike.
Geographic Information Systems
A GIS is a system the stores and displays maps electronically. Its a smart tool that helps us understand the world around us better, to get our work done more efficiently. I've been interested in GIS since one of my first jobs where I was in charge of writing a routing and optimising algorithm for solving a variant of the Travelling Sales Problem. Essentially our product was in charge of figuring out routes for workman to get their work down in the most efficient way possible, and send them routes on their mobile devices so they didn't get lost. It was really interesting work, we worked with providers of GIS data about the road network, and with the UK government for access to electronic versions of their maps.
I think part of my interest also comes from travelling. When I first go to a new city, I'm always keen to find a map, to give me a feel of the layout. I always choose Lonely Planet over Rough Guide, because their maps are better. It was very strange when I was in Guyana in the Jungle, the only maps we had were from satellite images taken over 10 years ago, at a very low resolution. Most of the time we only have a vague idea of where we were at any time. Rivercourses flood, move, the tree cover prevents identification of key features. It made me realise how much we take accurate maps for granted.
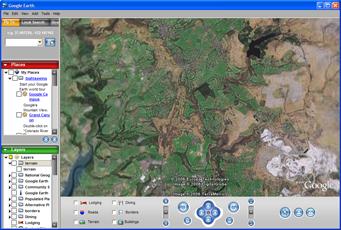
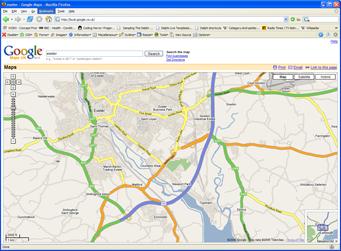
GIS is everywhere at the moment. Tom Tom are advertising their navigation products on TV. Google Local can show me a map of my local city in the time it takes to click a mouse, and Google Earth can let me zoom in from space to see my parents house, the roof of my dad's land rover. NASA can let me look at the surface of Venus.
Raster and Vector
The most important division in GIS to understand is the different between Raster and Vector information. Raster information is pictures, its pixels that show us what our cities look like from space. Its the images that digital cameras give us. Its resolution dependant. Vector information is mathematical in nature, its descriptions of things in terms of lines, circles, polygons.
Google earth is predominately raster based, as you zoom in loads in images with more detail.
Google Local is vector based, it shows you your local high street as a series of straight lines, it shows you the nearby river as a polygon.
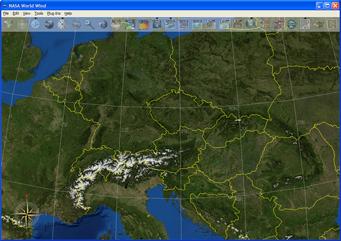
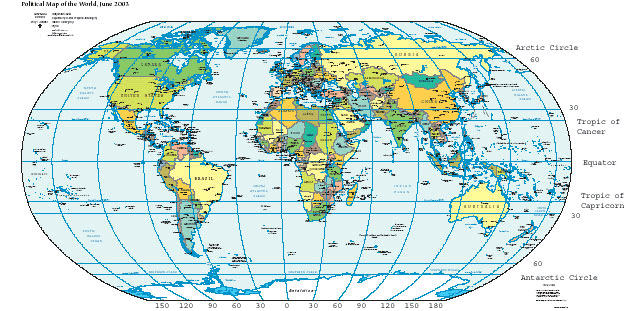
The real power comes when we use raster and vector together. When we turn on the country boundaries in NASA's World Wind we seem them overlaid over the raster images of earth:
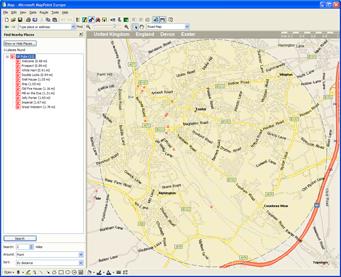
Raster information is an approximation to the real world, its pictures of the world. Vectors are mathematical, they are 'idealised' versions of the world. The mathematical nature of vectors allow us to use maths to answer questions like: "How many roads are there within 2 miles of the river ?". Or this more relevant example "Show me all the pubs within 2 miles of where I live" in Mappoint 2004:
Raster examples:
- Pictures of landscapes, from space or from aircraft
- Pictures of clouds
- Infrared pictures showing heat usage
Vector examples:
- Countries, Regions, Postal boundaries
- Streets, Motorways, Garages
- Wind speeds, wave heights
Organisations
OpenGIS
The main organisation dealing with GIS standards appears to be the "Open Geospatial Consortium", a group of 300 organisation worldwide. It has prepared various specifications for open standards:
- GML: A geographical data format based on XML
- Simple Features (SFSQL): A standard way to store data within standard SQL Databases
- Various web interfaces for providing both vector and raster information in agreed formats (GML)
Companies
The leaders in the industry for GIS software seem to be ESRI, Mapinfo and Integraph. The two largest data providers are NAVTEQ, used by Google maps, and TeleAtlas.
Representation
An important thing to understand in GIS is that there is no universal 'best' representation for coordinates on Earth. The earth is not an exact sphere, its not flat, so various different schemes have been invented. Which is used is, as ever, is dependant on what your trying to achieve.
Longitude and Latitude
The standard way of representing points on the earth is obviously using long and lat. Longitude is the lines from the North Pole to
the South Pole, with 0 degrees going through Greenwich, London. Latitude is the lines around the 'waist' of the earth, with 0 degrees
at the equator, + 90 degrees being the north pole.
Longitude and Latitude are measured against a known datum. This is the reference model used, i.e. the mathematical figures used for calculating the best fit shape of the Earth. The most common currently in use is the WGS84 datum (WGS stands for 'World Geodetic System'). It is possible to convert from one datum to another, but this can require some quite complex mathematics.
GPS
Global Positioning System is where a lot of GIS data is coming from. It is a set of satellites flying through space, transmitting signals allowing the calculation of very accurate position. GPS figures are long/lat figures based on the WGS84 datum.
Grid References
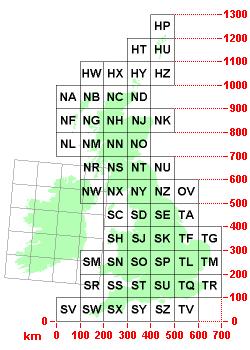
Rather than capture coordinates as spherical coordinates (like long/lat), coordinates can be stored as a reference on a grid. As the Earth is obviously not flat, this is an approximation, but can be easier to deal with when mapping smaller areas. The UK uses a grid reference system for its 'Ordnance Survey' (OS) maps. In this coordinate system, points are measured in Eastings and Northings. This grid is based on a different datum, OSGB36, based on a slightly different ellipsoid representation of the Earth. The 'Helmert' datum transformation can be used to convert to WGS84, but with an approximate error of 7m (depending on location). The image below shows where the eastings and northings are measured from. The letters in the grids allow another way of specifying location, called National Grid References (NGRs), with further digits specifying easting and northing offsets within each 100km grid square. More digits give more accuracy or specify a smaller area. An example of an NGR is 'NN 166 712'. This gives a 100m square area in Scotland. The good thing about NGS's is that they are useful shorthand to give approximate position, or for capturing an 'area'.
The UK government can provide digital maps of the country in GML, with currently 440 million distinct features taking up 660 Gigabytes of storage. The data is called OS Mastermap
Formats
GML and SVG
GML and SVG are both XML based standards that are used within GIS. GML stands for Geography Markup Language, and is a format designed to hold geographical features, geometry (vector), raster information, as well as units, coordinate representation systems, and map styles.
SVG is actually just a generic format for holding vector graphic information, and stands for Scalable Vector Graphics. Its like an Open Standard version of Adobe's Flash files, and supports both raster and vector information of any kind, not just geographic info. The customer we are doing the GIS work for currently uses SVG for their display of GIS data inside a web browser, using Adobe's free SVG plugin for Internet Explorer (note: firefox supports a subset of SVG natively now). SVG has well defined Javascript bindings so its easy to create interactive displays.
To me GML seems a better storage format and SVG a better display format.
Other
There are various file formats in use within the industry. Although the OpenGIS is pushing GML, most data seems to be available in either ESRI's shape format, or Mapinfo's standard file format. Both are proprietary, but easy to parse formats that most tools support.
Databases
There seems to be a big push to moving 'spatial' capabilities into databases at the moment. This makes sense as really geometry is just another attribute of an entity. Moving the geometry into database tables allows this data to be kept alongside other attributes, as well as allowing databases to carry out geospatial queries.
The market leader in geospatial databases is Oracle. All versions of their database support what they call Locator features. This allows the storages of complex vectors into tables, as well as support for complex queries (e.g. find me all objects that lie within the boundary of this polygon, find me there nearest 5 customers to our store). The top end product also has spatial features that allow very complex geometric calculations to be done. The nice thing is that the free Oracle Express (10g at the moment) supports the locator features. IBM's DB2 seems to have some sort of spatial extender but I couldn't find any information on the web about it.
Some of the GIS software companies provide software to help with database storage, like ESRI's ArcSDE, but these are just 'layers' that sit between software and the database, and are not open formats, tying you into using a particular vendor.
Two of the open source database engines have recently added spatial features to their engines. Postgres SQL has the addon PostGIS that supports the SFSQL specification mentioned above (as does Oracle). MySQL also has spatial extensions based on the SFSQL spec, but the current version (5.0) seems only to support planar (flat) and not spherical coordinate systems. The mathematics used for distances, areas, etc. are different for planar and spherical representations.
It was hoped that Microsoft SQL Server would add some spatial features to the new 2005 release, but this was not the case. There is however an interesting MSDN article showing how spatial features can be added to SQL Server, but this does not support open standards (surprise surprise).
Spatial Indexes
When reading about GIS formats, one of the key issues is how the formats are 'indexed' to make retrieval efficient. Oracle uses Helical Hyperspatial Codes (HHCodes), a data structure developed by the Canadian Hydrograph office. Despite the fancy name, it seems to be a binary tree, dividing each dimension in order. Its designed to support as many dimensions as desired, to an arbitrary level of detail. The MSDN article discusses the use of Hierarchical Triangular Meshes, which is a technique of covering a globe with a mesh of subdivided triangles. These seems work well for spherical mapping, but does not seem as general case as HHCodes. PostGIS and MySQL seems to use extensions of standard database indexes, rather than specific spatial indexing.
Summary
The GIS industry is becoming more and more important, as developers I can see us having to deal with spatial information more and more. If i get time I'll try and write an article on how to access SFSQL spatial data from within Delphi. For more information see Wikipedia's entry.
Comments (originally on blogger.com)
Paul Ramsey said...
PostGIS and MySQL use R-Tree indexes, which are rather specifically for spatial data (well, any data type which can be decomposed to a range rectangle). So does Oracle Spatial, for that matter. Space-filling curves, which map multi-dimensional data to something sortable into a B-Tree are ways of leveraging non-spatial database technology to be more useful for spatial data. Space-filling techniques tend not to be as balanced as R-Trees, however. The hierarchical grid is the final trick, and can be quite performant, but needs to be carefully tuned to the characteristics of the data, unlike R-Trees which automagically work for data of uneven scales.