Building a webmapping system
We will look at how easy it is to create your own web mapping platform.
First we will start with creating the javascript platform, pulling in data to display over the top. Will then go on to creating our own tile server based on OpenStreetmap.org data (I'll use the abbreviation OSM) in future articles.
1 - A basic javascript client
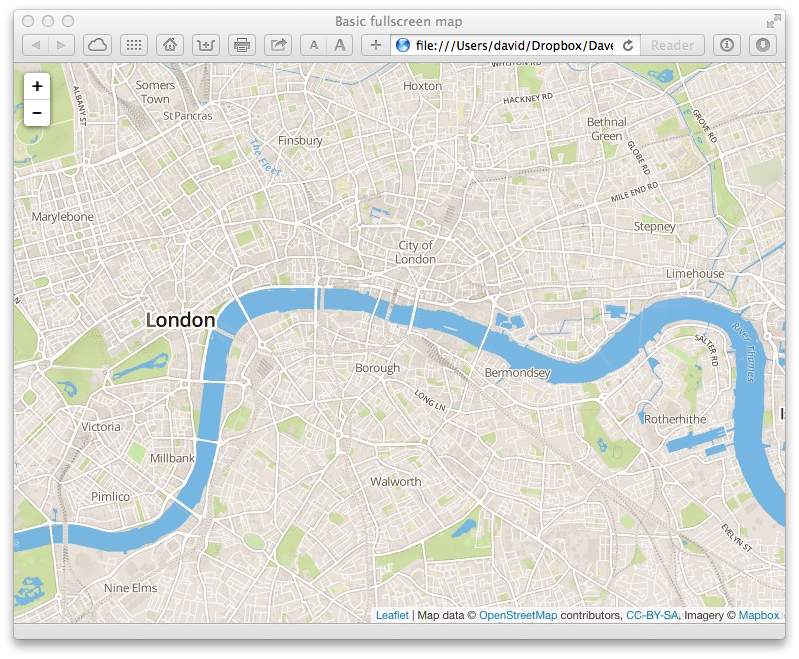
Start with a basic webpage, and use leaflet.js to show a map, using OSM tiles hosted by Mapbox. We use the CDN versions of the leaflet javascript and CSS.
<!DOCTYPE html> <html> <head> <title>Basic fullscreen map</title> <meta charset="utf-8" /> <meta name="viewport" content="width=device-width, initial-scale=1.0, maximum-scale=1.0, user-scalable=no"> <link rel="stylesheet" href="http://cdn.leafletjs.com/leaflet-0.7.3/leaflet.css" /> <style> html, body, #map { height:100%; width:100%; padding:0px; margin:0px; } </style> </head> <body> <div id="map"></div> <script src="http://cdn.leafletjs.com/leaflet-0.7.3/leaflet.js"></script> <script> var map = L.map('map').setView([51.505, -0.09], 13); L.tileLayer('https://{s}.tiles.mapbox.com/v3/{id}/{z}/{x}/{y}.png', { maxZoom: 18, attribution: 'Map data © <a href="http://openstreetmap.org">OpenStreetMap</a> contributors, ' + '<a href="http://creativecommons.org/licenses/by-sa/2.0/">CC-BY-SA</a>, ' + 'Imagery © <a href="http://mapbox.com">Mapbox</a>', id: 'examples.map-i875mjb7' }).addTo(map); </script> </body> </html>
We set the CSS of the html, body and map all to 100% which makes the map fullscreen. We set the viewport correctly so the map will work correctly on mobile devices.
2 - Pull in data to show over the top
Now we add some dynamic data and display it on top of the map. For the moment we will load a static GeoJSON file of UK surfing spots, but obviously this can be loaded via AJAX dynamically as required.
<script src="beaches.js"></script>
This file contains each beach marked up in GeoJSON:
{
    "geometry": {
        "coordinates": [
            -4.2315,
            51.1159
        ],
        "type": "Point"
    },
    "properties": {
        "link": "http://magicseaweed.com//Saunton-Sands-Surf-Report/1322/",
        "name": "Saunton Sands",
        "swell": "SW - NW"
    },
    "type": "Feature"
}
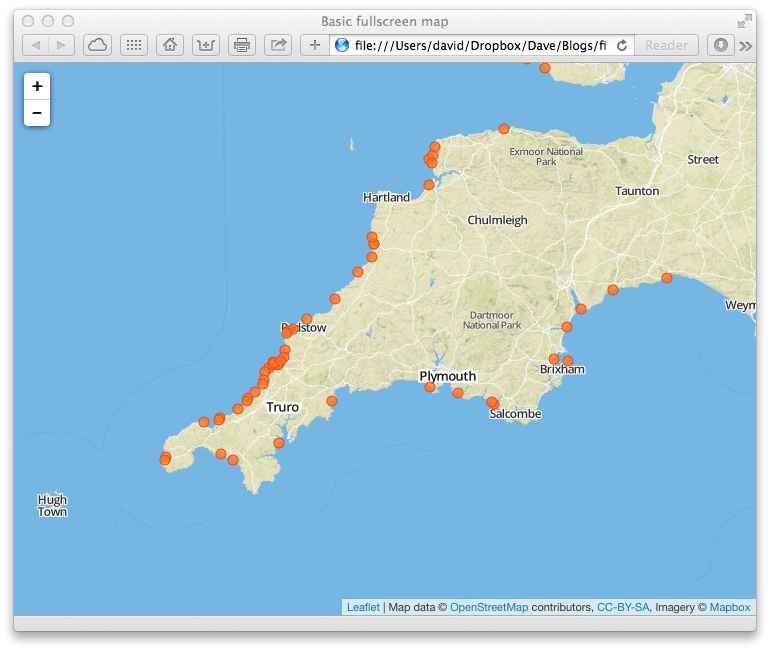
We then add the points to the map, passing in options to allow us to customise the look and feel of the points.
var geojsonMarkerOptions = {
    radius: 5,
    fillColor: "#ff7800",
    color: "#EE4500",
    weight: 1,
    opacity: 1,
    fillOpacity: 0.8
};

L.geoJson(beaches, {
    pointToLayer: function (feature, latlng) {
        return L.circleMarker(latlng, geojsonMarkerOptions);
    }
}).addTo(map);
We will also change the default position of the map to highlight some coastline.
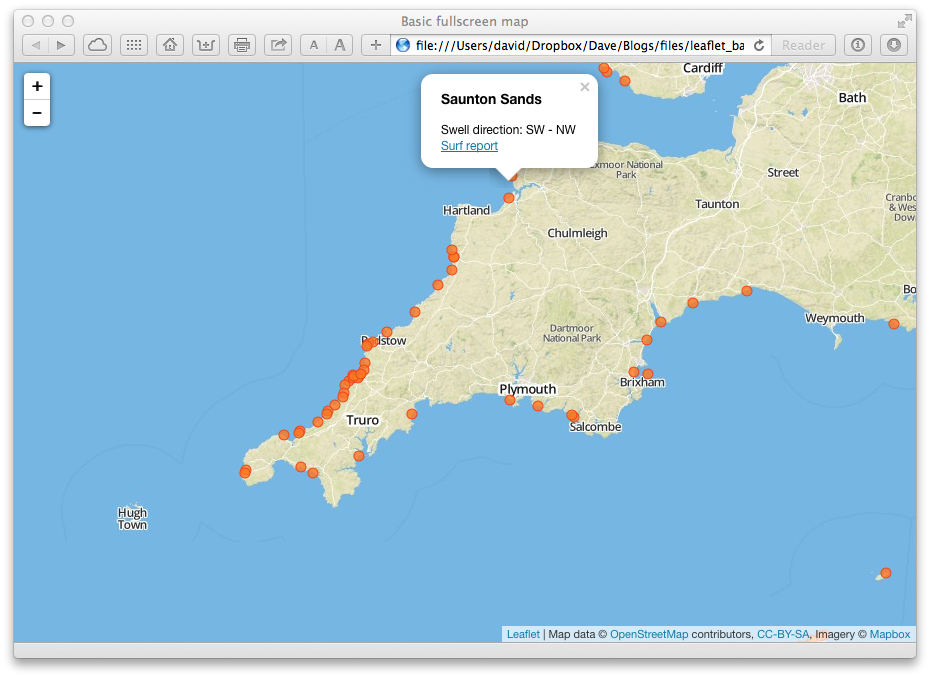
We now take advantage of the properties of each surf spot in the GeoJSON, by adding a popup in javascript to show us information about the beach when we click on it. To do this we just add an option passed to the geoJson call in leaflet that deals with click events
// Function for displaying appropriate information in the popup
function onEachFeature(feature, layer) {
	if (!feature.properties || !feature.properties.swell)
		return;
	var popupContent = "<h3>" + feature.properties.name + "</h3>" + "Swell direction: " +
		feature.properties.swell + "<br><a href='" + feature.properties.link + "'>Surf report</a>"
	layer.bindPopup(popupContent);
}

L.geoJson(beaches, {
    pointToLayer: function (feature, latlng) {
        return L.circleMarker(latlng, geojsonMarkerOptions);
    },
	onEachFeature: onEachFeature
}).addTo(map);
3 - Supporting more than one sort of tile
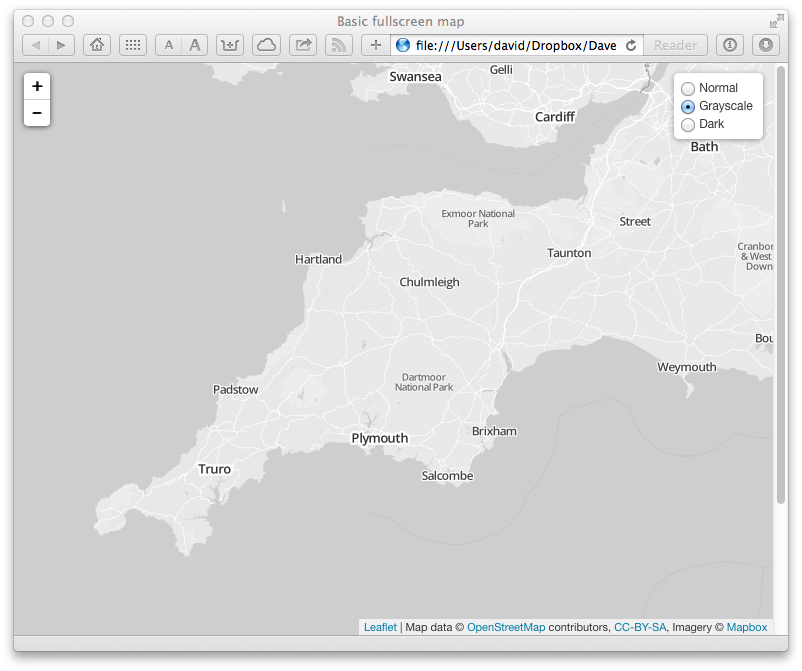
Often with maps you want to be able to change the tiles you are viewing. With leaflet this is dead easy, lets add two more tiles to our example ( a greyscale set of tiles, and a darker version ). We define our multiple tile sources, and then use the leaflet layer control to allow them to be toggled.
// Constants for URL and attribution var tile_url = 'https://{s}.tiles.mapbox.com/v3/{id}/{z}/{x}/{y}.png'; var attribution = 'Map data © <a href="http://openstreetmap.org">OpenStreetMap</a> contributors, ' + '<a href="http://creativecommons.org/licenses/by-sa/2.0/">CC-BY-SA</a>, ' + 'Imagery © <a href="http://mapbox.com">Mapbox</a>'; // Build different tile layers (the id is what switchs between different mapbox tiles) var normal = L.tileLayer(tile_url, { id: 'examples.map-i875mjb7', attribution: attribution}), dark = L.tileLayer(tile_url, { id: 'examples.map-0l53fhk2', attribution: attribution}), grayscale = L.tileLayer(tile_url, { id: 'examples.map-20v6611k', attribution: attribution}); // Load the map var map = L.map('map', { center: [50.505, -4.49], zoom: 8, layers: [normal] }); var baseLayers = { "Normal": normal, "Grayscale": grayscale, "Dark": dark }; var overlays = { }; L.control.layers(baseLayers, overlays).addTo(map);
In the screenshot below you can see the tile chooser top right, this is orignally an icon that opens up when you mouse over.
4 - Adding back our beaches and toggling them
We want our nice beach display back, so we need to add them into a layer, and add the layer to layer control. We create a new layer group, add pass it the layer control by adding it to the overlays object. Now we load the GeoJSON as before, but rather than adding it direct to the map, we add it to the beach layer, to be show or hidden as desired.
var beach_layer = new L.LayerGroup();

var overlays = {
	"Beaches": beach_layer
};

L.control.layers(baseLayers, overlays).addTo(map);

var geojsonMarkerOptions = {
    radius: 5,
    fillColor: "#ff7800",
    color: "#EE4500",
    weight: 1,
    opacity: 1,
    fillOpacity: 0.8
};

// Function for displaying appropriate information in the popup
function onEachFeature(feature, layer) {
	if (!feature.properties || !feature.properties.swell)
		return;
	var popupContent = "<h3>" + feature.properties.name + "</h3>" + "Swell direction: " +
		feature.properties.swell + "<br><a href='" + feature.properties.link + "'>Surf report</a>"
	layer.bindPopup(popupContent);
}

L.geoJson(beaches, {
    pointToLayer: function (feature, latlng) {
        return L.circleMarker(latlng, geojsonMarkerOptions);
    },
	onEachFeature: onEachFeature
}).addTo(beach_layer);
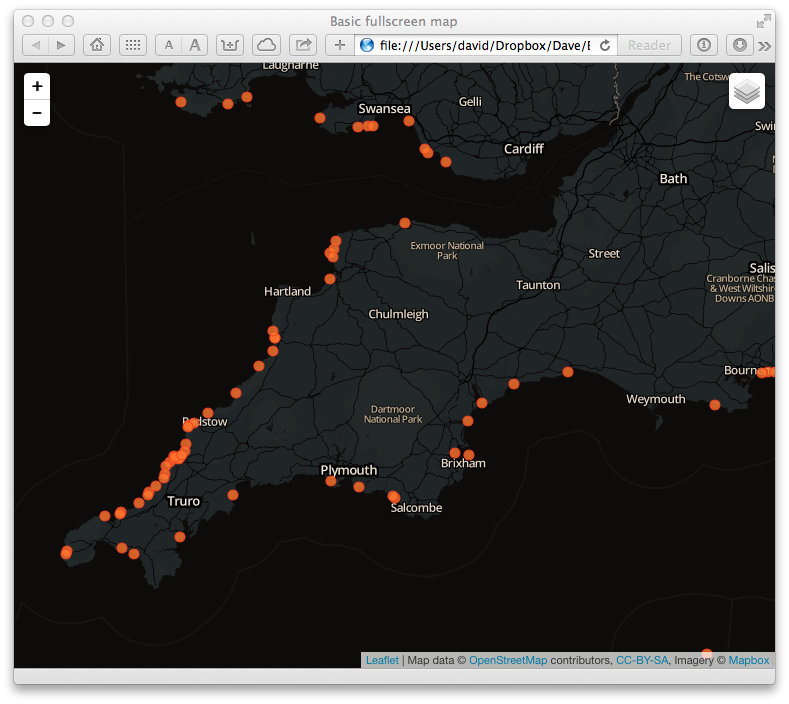
All done, now we can toggle our background tiles, and we can toggle the display of overlap information, beaches in our case. Below is a screenshot of the dark tiles with beach display turned on.
Here is the interactive version.