Loading dynamic data into our map
Following on from last time, we will now add dynamic data to our map. Will we have the webpage use dynamic ajax calls to load data from the server.
First thing is to get a simple webserver up and running. We must host the website and the data feed at the same address for security reasons (although this can be got around using JSONP). I'll use a simple ruby sinatra server:
require 'sinatra'
require 'json'

get '/' do
  File.read('index.html')
end
Running this will bring up a simple server that just hosts our index page from last time (on port localhost:4567 by default)
In order to show dynamic data we need to:
- Hook events on the map, allowing us to react to the user zooming and panning the map
- Call the server to load the data for the current view
- Handle the user showing and hiding different layers, and making sure we only request data from the server when needed
Leaflet map events
There is a full API reference available, but in this instanace we need to request events just for moveend. The moveend will tell us when the user has finised panning or zooming.
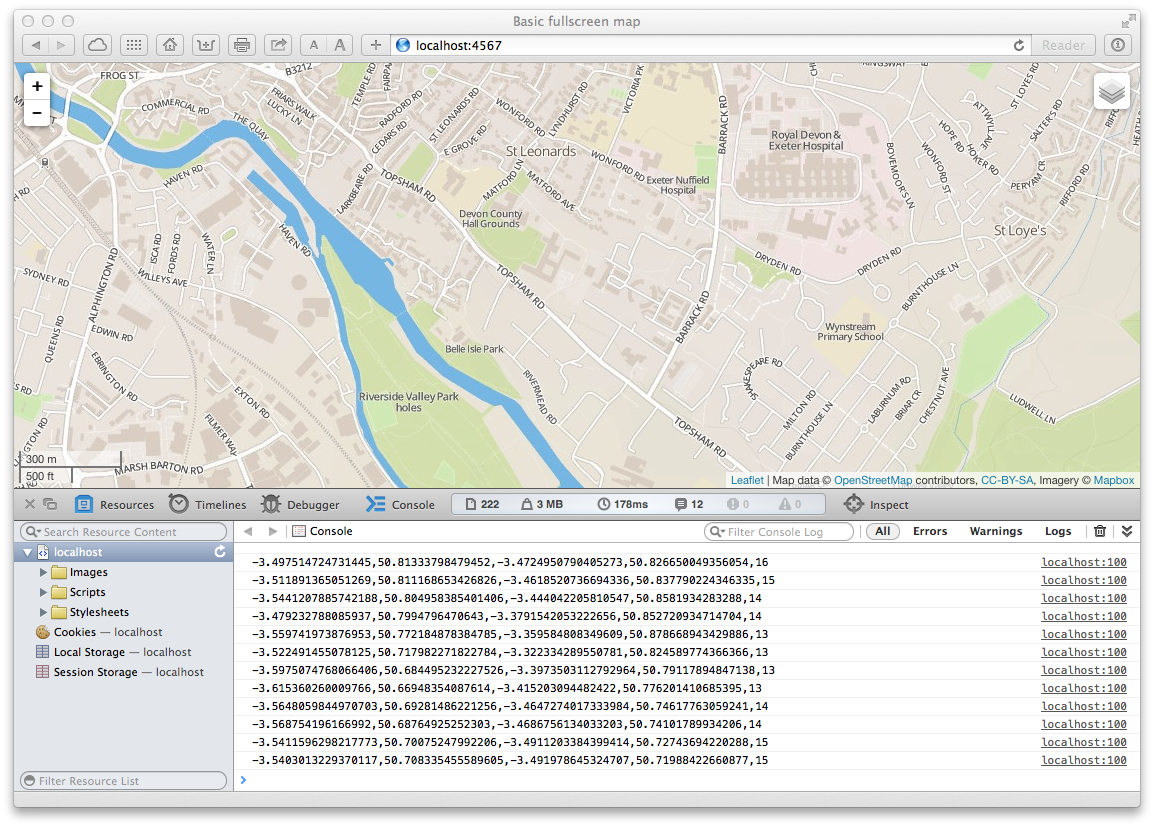
Below we hook up a js function to be called every time the map moves. In the event handler we get the current bounds of the view, and the zoom level, and output it to the console.
// Event handler for the map being moved/zoomed
function map_moved() {
    var bnd = map.getBounds();
    var zoom = map.getZoom();
    var loc = bnd.toBBoxString() + "," + zoom;
    console.log(loc);
}

// Listen to move event
map.on('moveend', map_moved);
Moving around a bit gives us this:
Calling the server
Now we want to call the server, letting it now the current view of data. To call the server we can use standard jquery. We pass a query parameter of box which contains the view of the map, and the current zoom level. Once a response comes from the server, we just dump it to the console.
<script src="//code.jquery.com/jquery-1.11.1.min.js"></script>
function map_moved() {
    var bnd = map.getBounds();
    var zoom = map.getZoom();
    var loc = bnd.toBBoxString() + "," + zoom;
	console.log(loc);
	$.getJSON('/1?box=' + loc , function (serverData) {
		console.log(serverData);
	});
}
We need to hook up the server side as well. We add a route that returns JSON, for the minute just returning JSON that contains the params we passed in, to confirm all comms are working.
require 'sinatra'
require 'json'

get '/' do
  File.read('index.html')
end

get '/1' do
  # Incoming call will look like http://localhost:4567/1?box=-3.517792224884033,50.71578134208988,-3.498995304107666,50.71930006299481,16
  box = params[:box].split(',')
  content_type :json
  {
    min_lng:box[0],
    min_lat:box[1],
    max_lng:box[2],
    max_lat:box[3],
    zoom:box[4]
  }.to_json
end
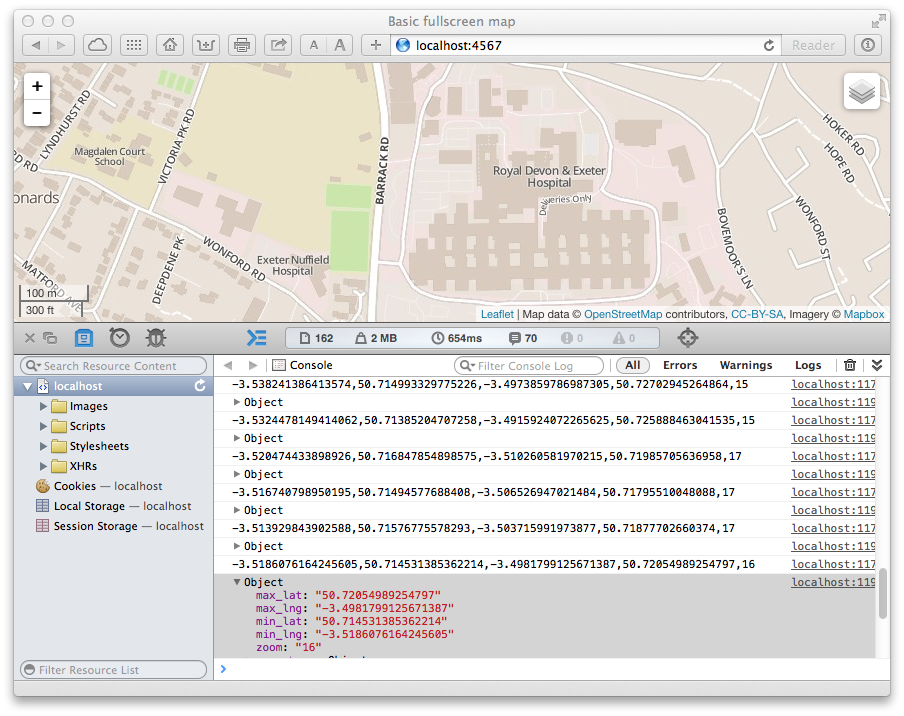
We can now see in the javascript console the reponse from the server, confirming everything is working properly.
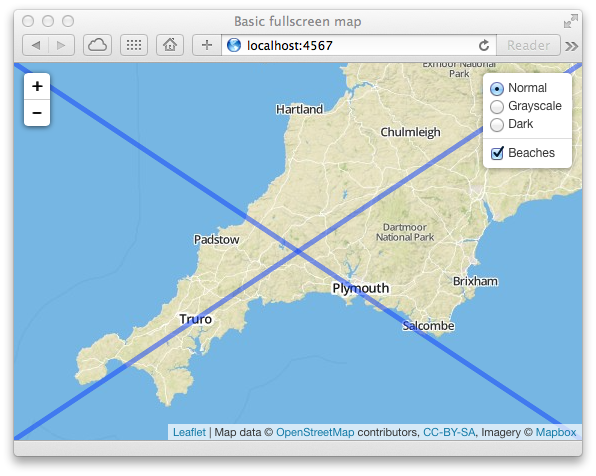
Now we will return some actual GeoJSON to display on the map. For this demo we will just create a cross on the screen.
We will extend our ruby server side code to generate some GeoJSON for a cross.
get '/1' do
  box = params[:box].split(',')
  # Incoming call will look like http://localhost:4567/1?box=-3.517792224884033,50.71578134208988,-3.498995304107666,50.71930006299481,16

  content_type :json
  {
    type: "FeatureCollection",
    features: [
      {
        type:'Feature',
        geometry: {
          type:'LineString',
          coordinates: [ [box[0], box[1]],[box[2], box[3]] ]
        },
        properties: {}
      },
      {
        type:'Feature',
        geometry: {
          type:'LineString',
          coordinates: [ [box[0], box[3]],[box[2], box[1]] ]
        },
        properties: {}
      }
    ]
  }.to_json
end
Which will return something looking like:
{
    "features": [
        {
            "geometry": {
                "coordinates": [
                    [
                        "-3.517792224884033",
                        "50.71578134208988"
                    ],
                    [
                        "-3.498995304107666",
                        "50.71930006299481"
                    ]
                ],
                "type": "LineString"
            },
            "properties": {},
            "type": "Feature"
        },
        {
            "geometry": {
                "coordinates": [
                    [
                        "-3.517792224884033",
                        "50.71930006299481"
                    ],
                    [
                        "-3.498995304107666",
                        "50.71578134208988"
                    ]
                ],
                "type": "LineString"
            },
            "properties": {},
            "type": "Feature"
        }
    ],
    "type": "FeatureCollection"
}
We just change our map_moved event handler to load the data into our previous beach layer (note we need to clear out the previous data first):
function map_moved() {
    var bnd = map.getBounds();
    var zoom = map.getZoom();
    var loc = bnd.toBBoxString() + "," + zoom;
    $.getJSON('/1?box=' + loc , function (serverData) {
        beach_layer.clearLayers();
        L.geoJson(serverData).addTo(beach_layer);
    });
}
It's not particularly impressive, but it does open up huge possibilities for loading server side dynamic views easily.
Next Steps
The next steps to make this fully featured would be to handle the overlayadd and overlayremove events from the map, to only request data when a layer is being displayed, and to hide or load as soon as the user makes their choice.
The javascript can be easily extended to handle as many layers are required, with custom styles, minimum zoon levels, etc. This is left as an exercise for the reader :D
For example, the following config should give you some ideas:
// Definition of overlays
var overlays = {

    Beaches: {
        url: 'Data/1?box=',
        min_zoom: 17,
        style: {
            weight: 2,
            color: '#03F'
        }
   },

   Roads: {
       url: 'Data/2?box=',
       min_zoom: 17,
       style: {
           weight: 2,
           color: '#bc8f8f'
       }
Conclusion
Added dynamic data is pretty easy, and the asynchronous nature of AJAX calls means the user isn't slowed down waiting for dynamic data to load.
For a more robust solution we would need to consider server errors, netork problems, showing to the user when data is loading, etc.
Although it is straight forward to build this yourself, there are various plugins to leaflet available to make it even easier.